
Afew days ago we received an email from a friend at a machine shop. He had just finished a process capability analysis for a critical feature (a runout on a cylindrical part) and was shocked by
few days ago we received an email from a friend at a machine shop. He had just finished a process capability analysis for a critical feature (a runout on a cylindrical part) and was shocked by the output. The spreadsheet software he used showed him a process capability (Cpk) of 0.39.
| ADVERTISEMENT |
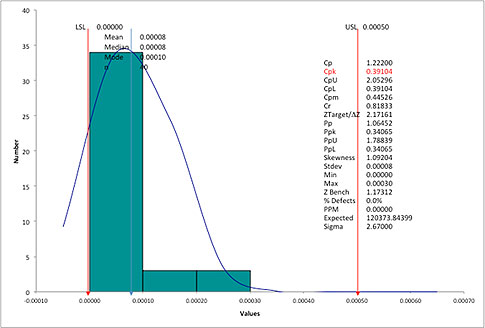
To put this in perspective, with a Cpk of 0.39, he should be seeing a nonconformance rate of between 12 percent and 24 percent, assuming a stable process and a normal distribution. However, he was actually experiencing a nonconformance rate close to zero. In fact, he hadn’t had any problems with runout as far back as he could remember.
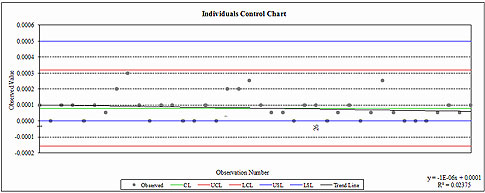
Why was the software telling him that his Cpk was 0.39 when the process was stable and located far away from the upper specification limit (USL)? The individuals control chart in figure 2 shows that the process is stable. So what was his real process capability?
Sources of errors
In general, we find two sources of error during process capability analysis:
1. The practitioner has violated one of the assumptions required for proper analysis. (For a list of assumptions, see “Pitfalls to Avoid with Cp, Cpk Process Capability Analysis.”)
2. The practitioner has not taken into consideration the “nature of the characteristic” being measured and has used an incorrect formula, or the software being used does not utilize the correct formula.
The nature of the characteristic
Runouts are specified with a single value: a not-to-exceed value. For example, the specification for runout was 0.0005 inches in this case. This means that the USL = 0.0005 in. But what is the lower specification limit (LSL)? And what is the nominal?
The LSL is obviously zero. In fact, zero is a hard limit; you can’t have a runout value less than zero. In addition, the nominal and the target value are also zero. In other words, in the ideal case, we should not have any runout.
Notice that the nominal is not midway between the USL and the LSL. Instead the nominal = LSL. These two facts, a hard LSL of zero, and a nominal = LSL, make runout a very special feature.
To make matters worse, runout data are often not normally distributed. Instead of a symmetrical distribution with a hump in the middle, we see a skewed distribution. A typical runout distribution will have a large number of values at or close to zero (the LSL), and fewer values closer to the USL.
Two challenges with runouts and other geometric dimensioning and tolerancing (GD&T) specifications
So now, we have identified two challenges with calculating Cpk for runouts:
1. The process is bounded and the nominal and target = LSL = zero
2. A non-normal distribution
1. The process is bounded and the nominal and target = LSL = zero
2. A non-normal distribution
Link source:
Nenhum comentário:
Postar um comentário